Free Access
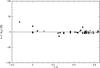
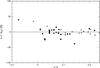
Fig. 5
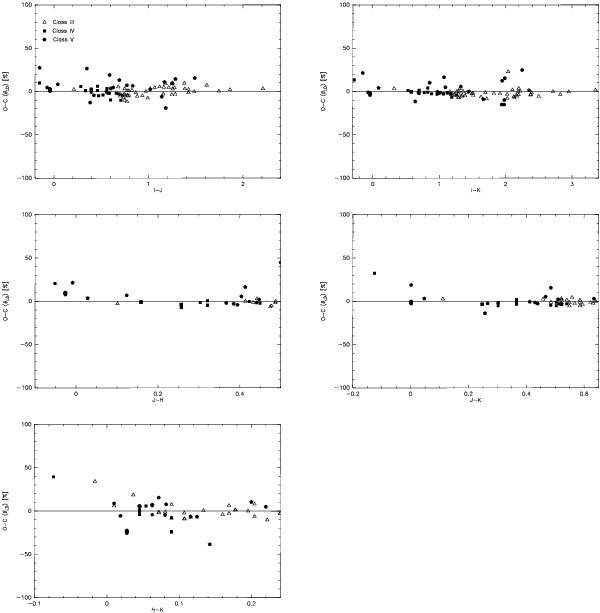
Relative difference between observed angular diameters θLD(obs) and computed ones θ(comp) with the five relations of Table 3 for the stars of Mozurkewich et al. (2003); Kervella & Fouqué (2008). O−C(θLD) = (θLD(obs) − θ(comp))/θLD(obs) are plotted in percent. The symbols are the same as for Fig. 4.
This figure is made of several images, please see below:
Current usage metrics show cumulative count of Article Views (full-text article views including HTML views, PDF and ePub downloads, according to the available data) and Abstracts Views on Vision4Press platform.
Data correspond to usage on the plateform after 2015. The current usage metrics is available 48-96 hours after online publication and is updated daily on week days.
Initial download of the metrics may take a while.