Fig. 5
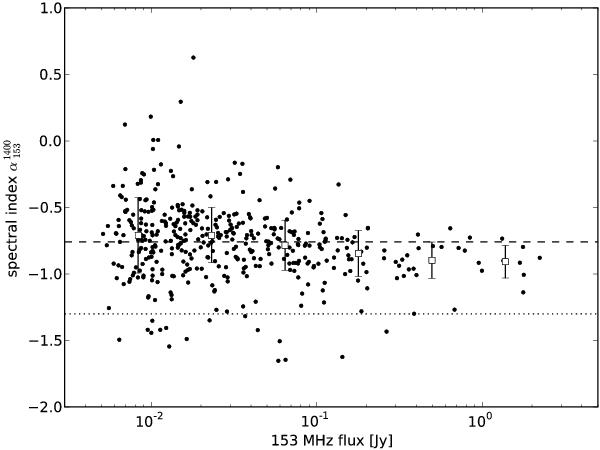
Spectral index between 1.4 GHz and 153 MHz for 417 sources, plotted as a function of the 153 MHz flux (black dots). The detection limit is almost fully determined by the 153 MHz survey due to the sensitivity of the 1.4 GHz observations. The median spectral index is − 0.76 (dashed line). 16 sources have a spectral index below − 1.3 (dotted line). The spectral indices are binned to emphasize the spectral flattening towards lower flux densities (white squares; see Table 6).
Current usage metrics show cumulative count of Article Views (full-text article views including HTML views, PDF and ePub downloads, according to the available data) and Abstracts Views on Vision4Press platform.
Data correspond to usage on the plateform after 2015. The current usage metrics is available 48-96 hours after online publication and is updated daily on week days.
Initial download of the metrics may take a while.