Fig. 3
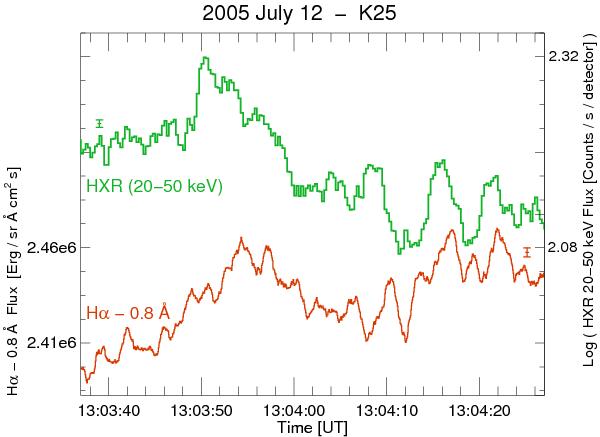
Time variations in the RHESSI HXR (20–50 keV) solar integrated flux (green histogram) and HT-MSDP-SECIS Hα fluxes (red histogram) of the K25 flaring kernel recorded during the M1.0 flare in NOAA 10 786 active region on 2005 July 12. The Hα flux were taken − 0.8 Å from the line centre and are on a linear scale. The RHESSI data are count rates (per second per detector) on a logarithmic scale. The vertical scales indicate the units of each. The integration times are 0.25 s for the demodulated HXR data, and 0.05 s for Hα data. The data were smoothed using a 1-s box-car filter for HXR flux and 0.5-s box-car filter for Hα light curves. The error bars indicate the standard deviations calculated for both light curves. Here and in the next two figures the error bars in the X-ray light curves are plotted on the left, while the error bars of the Hα light curves are plotted on the right.
Current usage metrics show cumulative count of Article Views (full-text article views including HTML views, PDF and ePub downloads, according to the available data) and Abstracts Views on Vision4Press platform.
Data correspond to usage on the plateform after 2015. The current usage metrics is available 48-96 hours after online publication and is updated daily on week days.
Initial download of the metrics may take a while.