Fig. 2
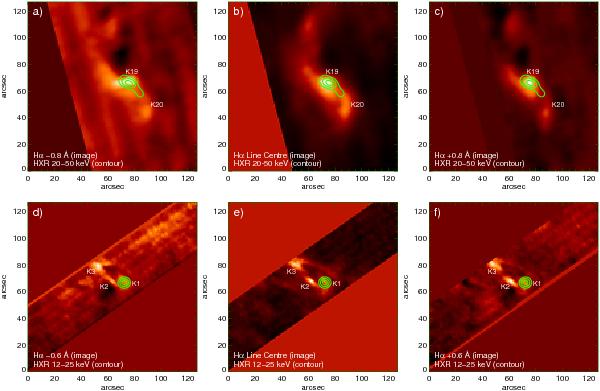
Hα and RHESSI HXR images (reconstructed using the PIXON method, detectors: 3, 4, 5, 6, 8, 9) co-aligned as described in the text. North is towards the top. The RHESSI images are shown as contours (at 50%, 70%, and 90% of maximum of signal). Panels: a), b), c) C8.3 flare – 2005 July 12, 08:00:52–08:00:56 UT (RHESSI 20–50 keV contours), 08:00:54 UT Hα image. Panels: d), e), f) C1.2 flare – 2003 July 16, 16:03:44–16:03:52 UT (RHESSI 12–25 keV contours), 16:03:46 UT Hα image. The dimensions of the areas shown are 128 × 128 arcsec2.
Current usage metrics show cumulative count of Article Views (full-text article views including HTML views, PDF and ePub downloads, according to the available data) and Abstracts Views on Vision4Press platform.
Data correspond to usage on the plateform after 2015. The current usage metrics is available 48-96 hours after online publication and is updated daily on week days.
Initial download of the metrics may take a while.