Fig. 1
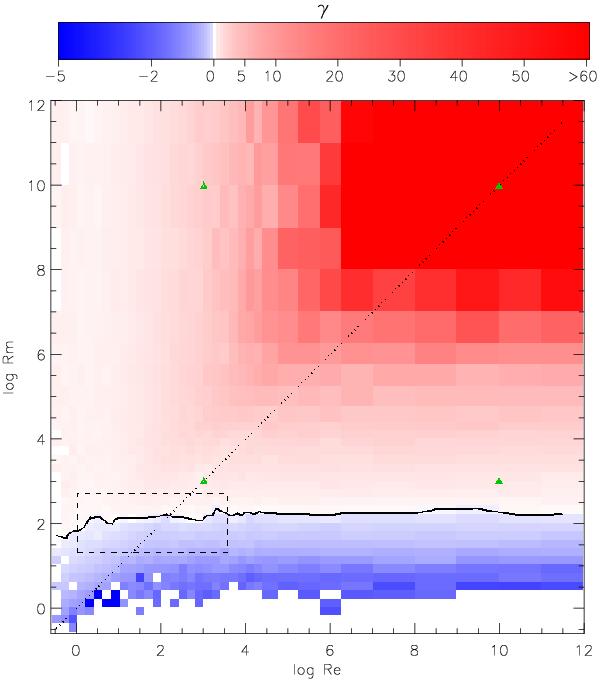
Growth rate γ as a function of the Reynolds numbers Re and Rm (note that the color scale is different for positive and negative values of γ), in the case of the weakly nonlocal Sabra model (α = −5/2). The stability curve, corresponding to the γ = 0 level line, is overplotted. The dashed rectangle corresponds to the range of parameters explored by the direct numerical simulations of Iskakov et al. (2007); the green triangles indicate the initial Reynolds numbers used in Fig. 4; the dotted line is where Pm = 1.
Current usage metrics show cumulative count of Article Views (full-text article views including HTML views, PDF and ePub downloads, according to the available data) and Abstracts Views on Vision4Press platform.
Data correspond to usage on the plateform after 2015. The current usage metrics is available 48-96 hours after online publication and is updated daily on week days.
Initial download of the metrics may take a while.