Free Access
Fig. 5
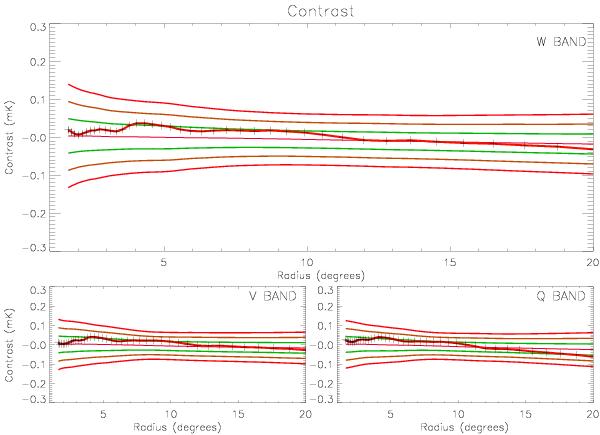
As above (in the W, V, and Q bands) the 1σ (green lines), 2σ (brown lines), and 3σ (red lines) excess temperature contrast (in mk/pixel) curves along with the mean profile (pink line close) for 500 random control fields. The real temperature contrast profile in the M 31 halo up to 20° (with 1σ errors) is given in red.
Current usage metrics show cumulative count of Article Views (full-text article views including HTML views, PDF and ePub downloads, according to the available data) and Abstracts Views on Vision4Press platform.
Data correspond to usage on the plateform after 2015. The current usage metrics is available 48-96 hours after online publication and is updated daily on week days.
Initial download of the metrics may take a while.