Fig. 3
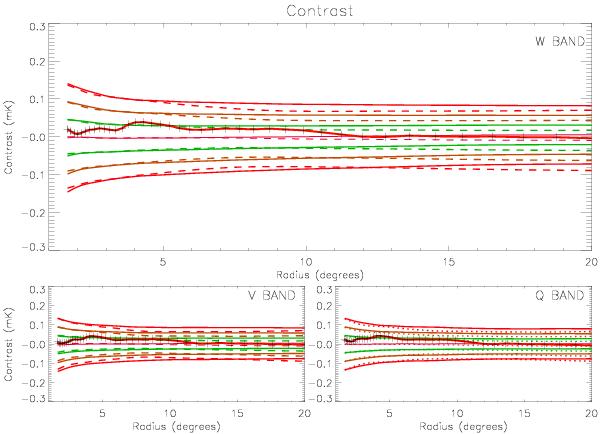
The same as Fig. 2 but for the M 31 halo (temperature contrast of the N1+S1 with respect to the N2+S2 regions in mK/pixel – red line) for 500 random control fields (continuous lines) and 500 simulated sky maps (dashed lines). Here the WMAP maps with the Galactic disk contribution modeled and removed (foreground-reduced maps) are used.
Current usage metrics show cumulative count of Article Views (full-text article views including HTML views, PDF and ePub downloads, according to the available data) and Abstracts Views on Vision4Press platform.
Data correspond to usage on the plateform after 2015. The current usage metrics is available 48-96 hours after online publication and is updated daily on week days.
Initial download of the metrics may take a while.