Fig. 3
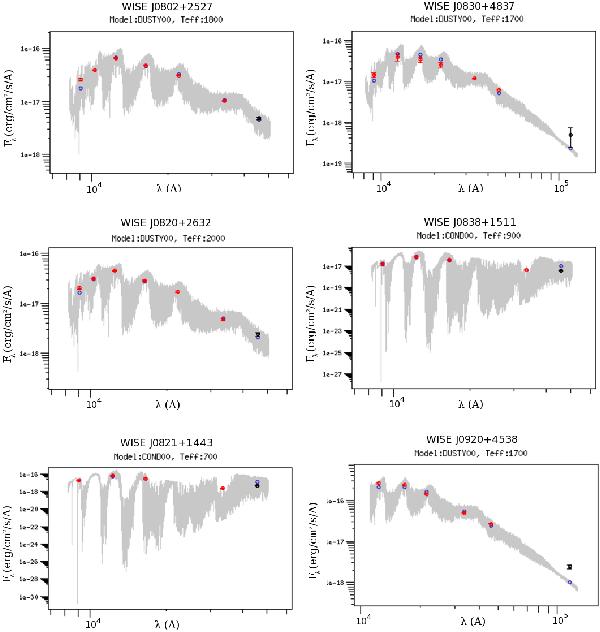
VOSA SED fitting for our six BD candidates. Catalogue and synthetic photometric points are represented in red and blue, respectively. Points not considered in the fitting are shown in black. Spectral bands are those listed in Table 1. The theoretical spectrum that best fits (and from which the synthetic photometry was computed by convolving with the corresponding filter profiles) is also plotted in grey.
Current usage metrics show cumulative count of Article Views (full-text article views including HTML views, PDF and ePub downloads, according to the available data) and Abstracts Views on Vision4Press platform.
Data correspond to usage on the plateform after 2015. The current usage metrics is available 48-96 hours after online publication and is updated daily on week days.
Initial download of the metrics may take a while.