Fig. 6
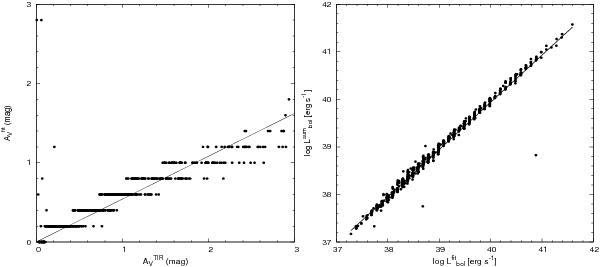
(Left panel) Comparison of the AV values for the YSC sample derived from two different methods: AV as given in Eq. (8) using the TIR luminosity ( ), and using the SED model fits (
 ). (Right panel) Same as the left panel, but for the luminosity estimated from the sum at different wavelengths (
 ) and from the SED model fits (
 ). In both cases, the best linear fit is shown by the solid line.
Current usage metrics show cumulative count of Article Views (full-text article views including HTML views, PDF and ePub downloads, according to the available data) and Abstracts Views on Vision4Press platform.
Data correspond to usage on the plateform after 2015. The current usage metrics is available 48-96 hours after online publication and is updated daily on week days.
Initial download of the metrics may take a while.