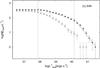
Fig. 3
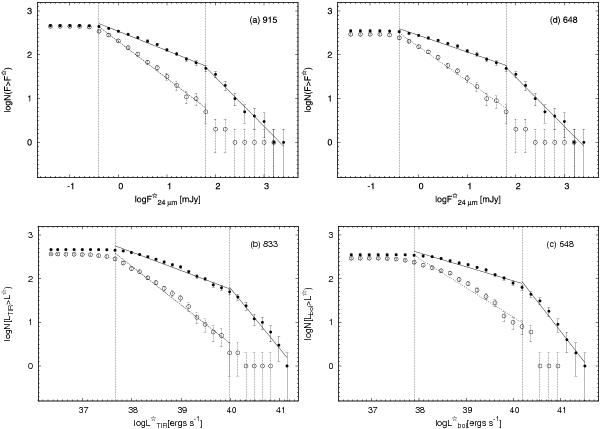
The cumulative luminosity functions of: a) the 24 μm sources (915), b) the 8 μm sources (833) shown as a function of LTIR, c) the selected YSCs (648) as a function of Lbol and d) the selected YSCs (648), as a function of the 24 μm flux. Filled and open circles represent counts in the inner and outer regions, respectively. Linear fits for different flux ranges are shown as solid lines for the inner sample, and dashed for the outer one.
Current usage metrics show cumulative count of Article Views (full-text article views including HTML views, PDF and ePub downloads, according to the available data) and Abstracts Views on Vision4Press platform.
Data correspond to usage on the plateform after 2015. The current usage metrics is available 48-96 hours after online publication and is updated daily on week days.
Initial download of the metrics may take a while.