Fig. 2
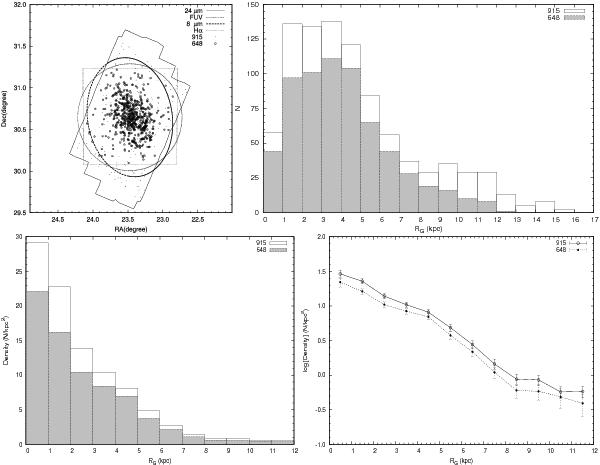
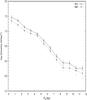
(Top left) Sky area covered by various maps along with the position of all the 24 μm sources (915, dot symbols) and the sample of YSCs (648, open circles). Coordinates are for the J2000 epoch. (Top right) Histogram of the number of clusters N as a function of the galactocentric distance RG for Mid-IR sources (white) and YSCs (grey). (Bottom left & right panels) Profiles of the number density of clusters per unit area in kpc2 in linear and log scale, respectively, as a function of galactocentric distance for the same samples. See text for details on the disk deprojection model.
Current usage metrics show cumulative count of Article Views (full-text article views including HTML views, PDF and ePub downloads, according to the available data) and Abstracts Views on Vision4Press platform.
Data correspond to usage on the plateform after 2015. The current usage metrics is available 48-96 hours after online publication and is updated daily on week days.
Initial download of the metrics may take a while.