Free Access
Fig. 12
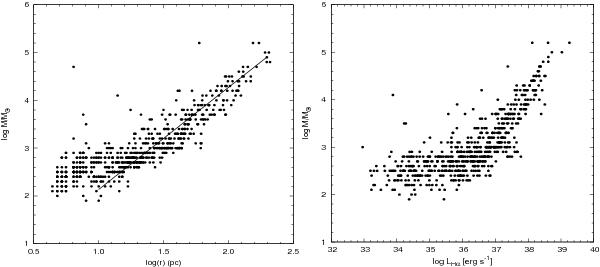
(Left panel) Distribution of cluster mass as a function of size. The best fit for clusters with size > 10 pc is shown by a solid line. Masses have been corrected for incompleteness. (Right panel) Relation between cluster mass and the Hα luminosity.
This figure is made of several images, please see below:
Current usage metrics show cumulative count of Article Views (full-text article views including HTML views, PDF and ePub downloads, according to the available data) and Abstracts Views on Vision4Press platform.
Data correspond to usage on the plateform after 2015. The current usage metrics is available 48-96 hours after online publication and is updated daily on week days.
Initial download of the metrics may take a while.