Fig. 11
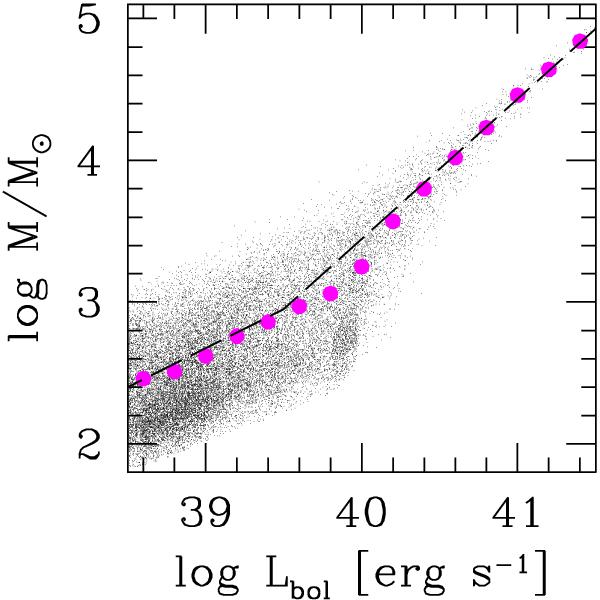
Simulated distribution of cluster mass as a function of the cluster bolometric luminosities at birth. The large filled circles show the average cluster mass in each bolometric luminosity bin. The broken dashed line is a fit to the average log M − log Lbol relation: at high luminosities it follows the linear relation between mass and luminosity expected for a fully populated IMF, while for log Lbol < 3 × 1039 erg s-1 it approximates well the simulation results.
Current usage metrics show cumulative count of Article Views (full-text article views including HTML views, PDF and ePub downloads, according to the available data) and Abstracts Views on Vision4Press platform.
Data correspond to usage on the plateform after 2015. The current usage metrics is available 48-96 hours after online publication and is updated daily on week days.
Initial download of the metrics may take a while.