Fig. 10
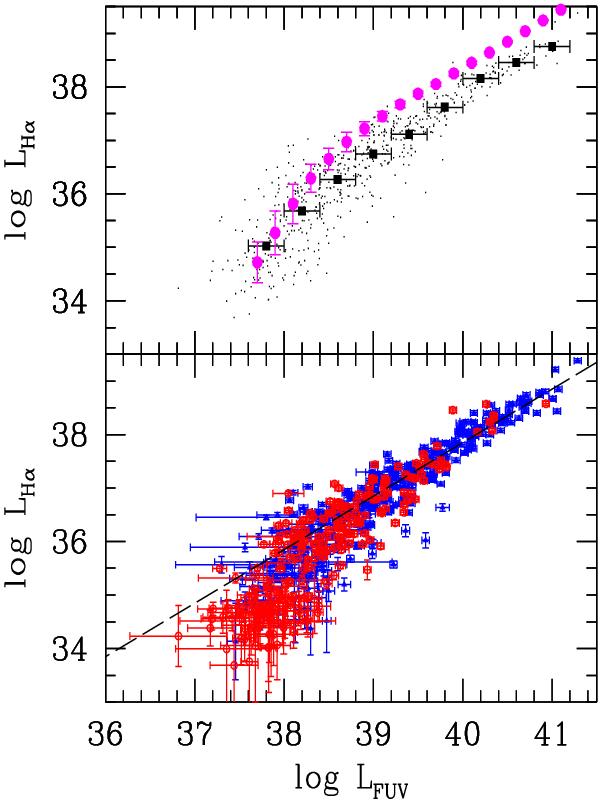
(Bottom panel) Distribution of Hα luminosities as a function of FUV luminosities corrected for extinction according to the best fitting SED model. Units are erg s-1. The dashed line shows the linear relation consistent with the distribution for bright clusters. Filled triangles and open circles are for inner and outer disk YSCs, respectively. (Top panel) The same data are shown using small dots together with the average value of log LHα (filled squares) in 0.4 wide bins of log LFUV. The filled circles show the expected values as derived from the simulation of the stochastic IMF for clusters at birth.
Current usage metrics show cumulative count of Article Views (full-text article views including HTML views, PDF and ePub downloads, according to the available data) and Abstracts Views on Vision4Press platform.
Data correspond to usage on the plateform after 2015. The current usage metrics is available 48-96 hours after online publication and is updated daily on week days.
Initial download of the metrics may take a while.