Fig. 3
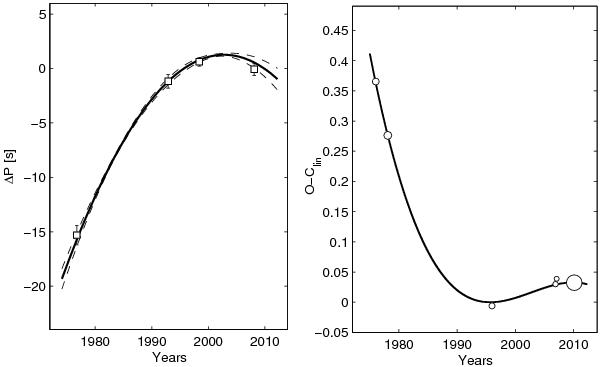
Long-term variations in the rotational period and O-C diagram of V901 Ori. Left: variation in the rotation period ΔP in seconds with respect to the mean period P0 = 1ḍ538756(3), derived from 2611 individual measurements. The 1-σ deflections from the quadratic fit are denoted by dashed lines. Points with error bars correspond to virtual period deflections for appropriately selected groups of consecutive individual data items. Right: the difference of the observed zero phase time and the time calculated according to the linear ephemeris in fractions of a day. Each point represents an average of 435 consecutive measurements; the weights of these means are indicated by their areas.
Current usage metrics show cumulative count of Article Views (full-text article views including HTML views, PDF and ePub downloads, according to the available data) and Abstracts Views on Vision4Press platform.
Data correspond to usage on the plateform after 2015. The current usage metrics is available 48-96 hours after online publication and is updated daily on week days.
Initial download of the metrics may take a while.