This article has an erratum: [https://doi.org/10.1051/0004-6361/201117684e]
Fig. 1
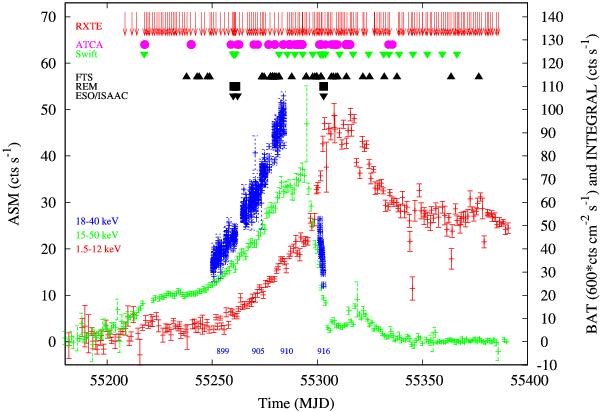
Daily RXTE/ASM (red), Swift/BAT (green) and INTEGRAL/ISGRI (per pointing, violet) light curves of GX 339 − 4 during the 2010 outburst. Other observations performed with ATCA, the FTS, the REM/ROSS, REMIR and the ESO/ISAAC telescopes are indicated. The blue numbers near the bottom of the figure are INTEGRAL revolution numbers (see Table 1 for details).
Current usage metrics show cumulative count of Article Views (full-text article views including HTML views, PDF and ePub downloads, according to the available data) and Abstracts Views on Vision4Press platform.
Data correspond to usage on the plateform after 2015. The current usage metrics is available 48-96 hours after online publication and is updated daily on week days.
Initial download of the metrics may take a while.