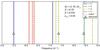
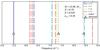
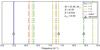
Fig. 1
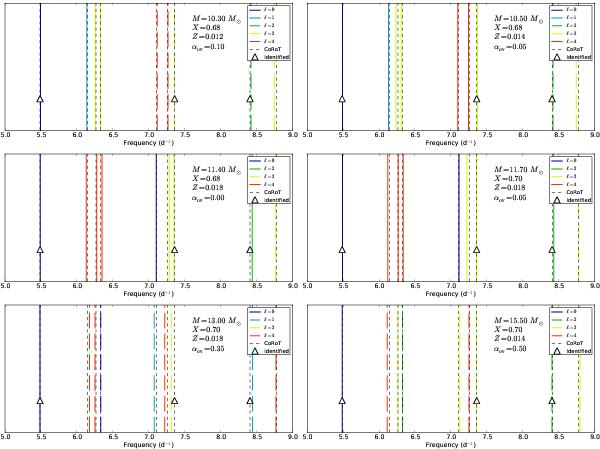
Models with predicted oscillation frequencies fitting the nine detected frequencies and fulfilling the mode identification as listed in Table 1. In the four upper panels, the dominant mode is the radial fundamental while in the lower left panel it is the first overtone and in the lower right panel the fourth overtone. Full coloured lines indicate excited modes while dashed coloured lines indicate stable modes.
Current usage metrics show cumulative count of Article Views (full-text article views including HTML views, PDF and ePub downloads, according to the available data) and Abstracts Views on Vision4Press platform.
Data correspond to usage on the plateform after 2015. The current usage metrics is available 48-96 hours after online publication and is updated daily on week days.
Initial download of the metrics may take a while.