Fig. 7
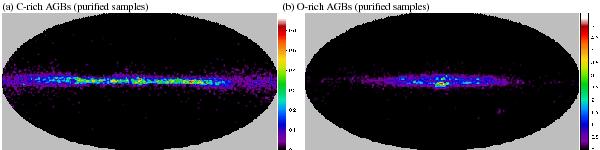
Spatial distributions of the purified samples of a) C-rich AGB stars and b) O-rich AGB stars in density maps in the Galactic coordinates. The purified sample corresponds to those belonging to all the occupation zones of the [J] − [K] vs. [K] − [9] (Fig. 2a), [K] − [9] vs. [9] − [18] (Fig. 3a), and [J] − [K] vs. [9] − [18] diagrams (Fig. 4a). The color scales are linear from 0% to 100% of the peak value and given in units of deg-2.
Current usage metrics show cumulative count of Article Views (full-text article views including HTML views, PDF and ePub downloads, according to the available data) and Abstracts Views on Vision4Press platform.
Data correspond to usage on the plateform after 2015. The current usage metrics is available 48-96 hours after online publication and is updated daily on week days.
Initial download of the metrics may take a while.