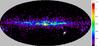
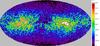
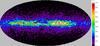
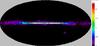
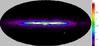
Fig. 6

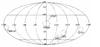
Spatial distributions of the AKARI/MIR sources in density maps in the Galactic coordinates of the Aitoff projection. These sources are classified on the basis of the [9] − [18] vs. [J] − [K] color–color diagram alone (candidate samples). We show groups A, C, D, E, and F because they have a sufficiently large number of members. The color scales are linear from 0% to 50% of the peak value and given in units of deg-2. The coordinate grids and the locations of the Galactic bulge, the LMC, the SMC, and the nearby star-forming regions are shown in the lower right panel.
Current usage metrics show cumulative count of Article Views (full-text article views including HTML views, PDF and ePub downloads, according to the available data) and Abstracts Views on Vision4Press platform.
Data correspond to usage on the plateform after 2015. The current usage metrics is available 48-96 hours after online publication and is updated daily on week days.
Initial download of the metrics may take a while.