Fig. 2
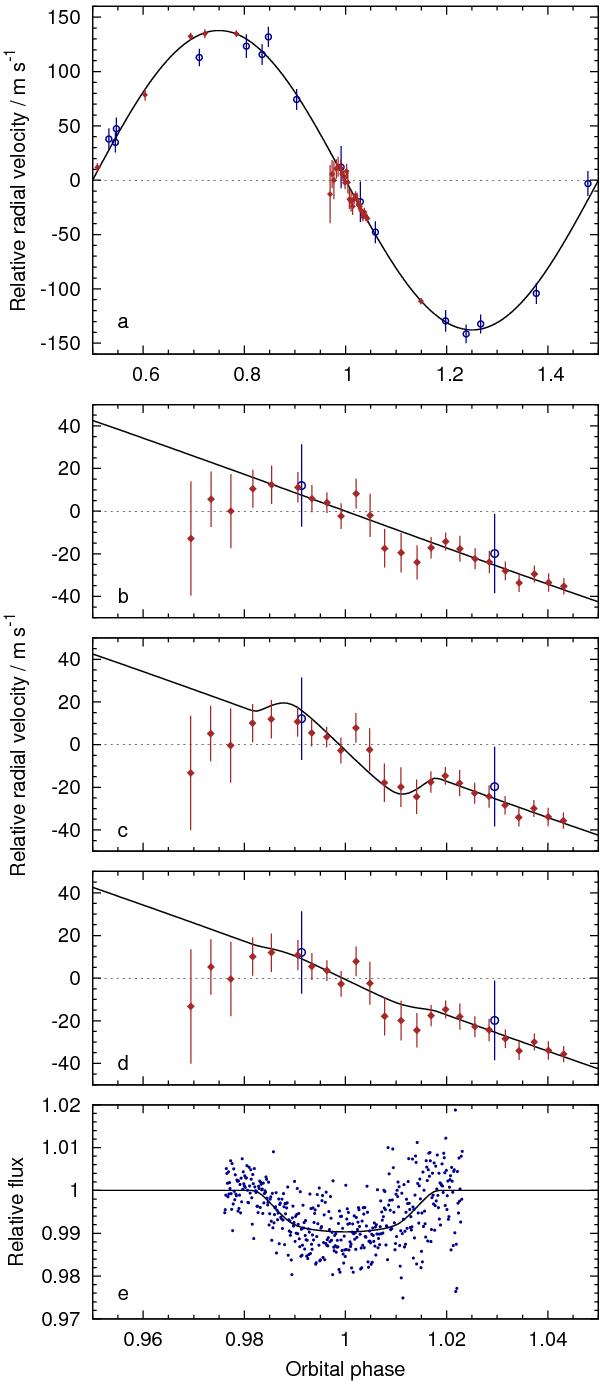
a) The CORALIE (blue circles) and HARPS (brown diamonds) RVs of WASP-26. b)–d) Expansions of the region around the spectroscopic transit, as measured by HARPS on 2010 Sep. 12, in which the RM effect is not modelled b), the RM effect is modelled and a prior is imposed on vsinIc), the RM effect is modelled without a prior on vsinId). e): The Sloan r′-band transit light curve obtained at Oversky on 2010 Oct. 28/29.
Current usage metrics show cumulative count of Article Views (full-text article views including HTML views, PDF and ePub downloads, according to the available data) and Abstracts Views on Vision4Press platform.
Data correspond to usage on the plateform after 2015. The current usage metrics is available 48-96 hours after online publication and is updated daily on week days.
Initial download of the metrics may take a while.