Free Access
Fig. A.3
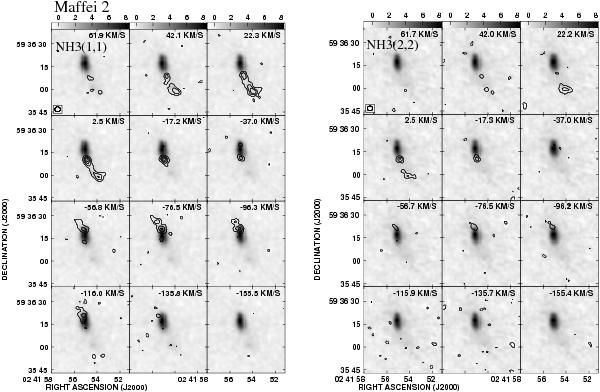
Channel maps of the NH3(1, 1) and NH3(2, 2) emission from Maffei 2. The contour levels are −0.78, 0.78, 1.56, 2.34, and 3.12 mJy beam-1 and −1.2, 1.2, 2.4, 3.6, and 4.8 mJy beam-1, respectively. The gray scale images show the continuum emission at 23.7 GHz. Beams are shown in the left upper panel for each map set.
This figure is made of several images, please see below:
Current usage metrics show cumulative count of Article Views (full-text article views including HTML views, PDF and ePub downloads, according to the available data) and Abstracts Views on Vision4Press platform.
Data correspond to usage on the plateform after 2015. The current usage metrics is available 48-96 hours after online publication and is updated daily on week days.
Initial download of the metrics may take a while.