Fig. 4
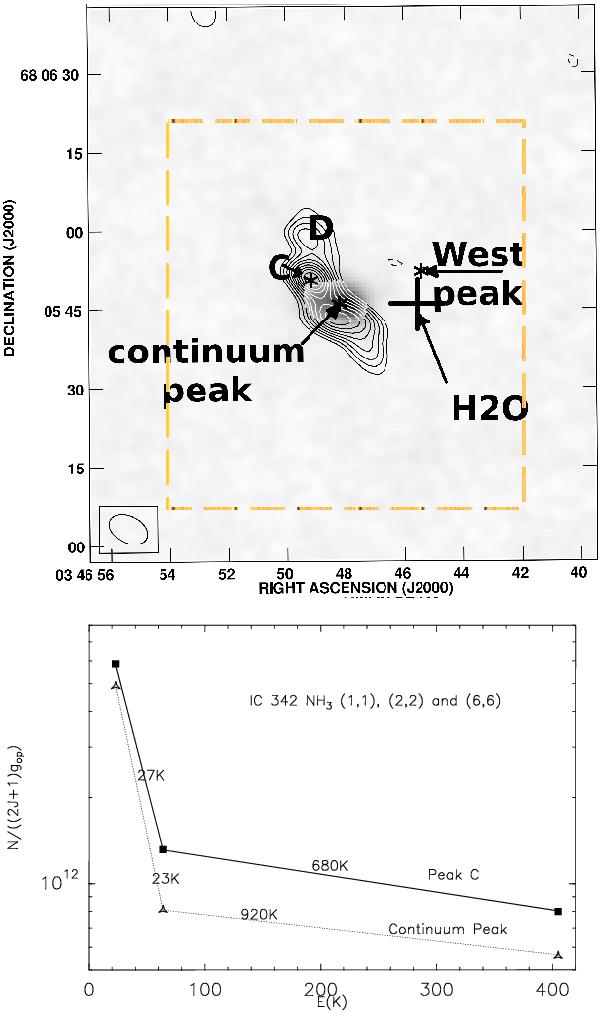
Upper frame: contours showing our IC 342 NH3 (J,K) = (2, 2) image smoothed to the same resolution as the Montero-Castaño et al. (2006) NH3(6, 6) emission image. The gray scale shows the 1.3 mm continuum, and the asterisks denote the three (6, 6) ammonia peaks. The H2O maser detected by Tarchi et al. (2002) is indicated as a cross, while the box indicates the area depicted in Fig. 1. Lower frame: Boltzmann plot for IC 342 peak C and the “continuum” peak using the measured (1, 1), (2, 2) and (6, 6) transitions of NH3.
Current usage metrics show cumulative count of Article Views (full-text article views including HTML views, PDF and ePub downloads, according to the available data) and Abstracts Views on Vision4Press platform.
Data correspond to usage on the plateform after 2015. The current usage metrics is available 48-96 hours after online publication and is updated daily on week days.
Initial download of the metrics may take a while.