Fig. 2
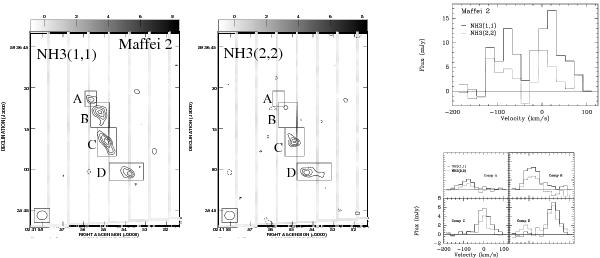
Images of the velocity-integrated NH3(1, 1) and NH3(2, 2) lines from Maffei 2. The emission was integrated from −135 km s-1 to 62 km s-1. The gray scale images are the continuum maps at the respective frequencies (~23.7 GHz) with the upper bars providing the flux density scale in mJy beam-1. The contour levels are −3, 3, 4, 5, and 6 times 1.3 mJy km s-1 beam-1 for the (1, 1) map and −3, 3, 4, 5, and 6 times 1.8 mJy km s-1 beam-1 for the (2, 2) map. The spectra to the right show the integrated NH3 emission (upper panel) and the spectra toward the four regions depicted in the contour maps (lower panel).
Current usage metrics show cumulative count of Article Views (full-text article views including HTML views, PDF and ePub downloads, according to the available data) and Abstracts Views on Vision4Press platform.
Data correspond to usage on the plateform after 2015. The current usage metrics is available 48-96 hours after online publication and is updated daily on week days.
Initial download of the metrics may take a while.