Fig. 1
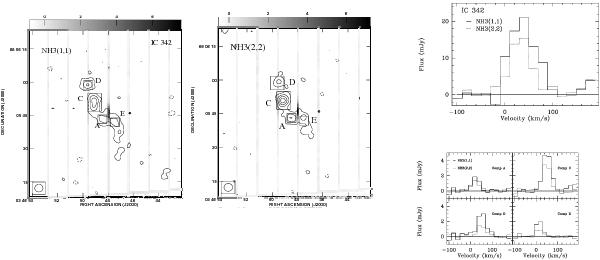
Shown as contours, emission integrated over the velocity range 0.45 to 59.8 km s-1 for the NH3(1, 1) transition (left) and NH3(2, 2) transition (central) toward IC 342. The contour levels are −3, 3, 6, 9 and 12 times 0.7 mJy km s-1 beam-1 for the (1, 1) map and −3, 3, 6, 9 and 12 times 0.5 mJy km s-1 beam-1 for the (2, 2) map. Overlaid in gray scale for each panel are the radio continuum maps at the respective frequencies (~23.7 GHz) with the upper bars providing the flux density scale in mJy beam-1. An asterisk indicates the location of the (western) water vapor maser detected by Tarchi et al. (2002), while the boxes indicate the areas that were taken for integrating the emission from each ammonia cloud identified from these data. The spectra to the right show the integrated NH3 emission (upper panel) and the spectra toward the four regions depicted in the contour maps (lower panel).
Current usage metrics show cumulative count of Article Views (full-text article views including HTML views, PDF and ePub downloads, according to the available data) and Abstracts Views on Vision4Press platform.
Data correspond to usage on the plateform after 2015. The current usage metrics is available 48-96 hours after online publication and is updated daily on week days.
Initial download of the metrics may take a while.