Fig. 3
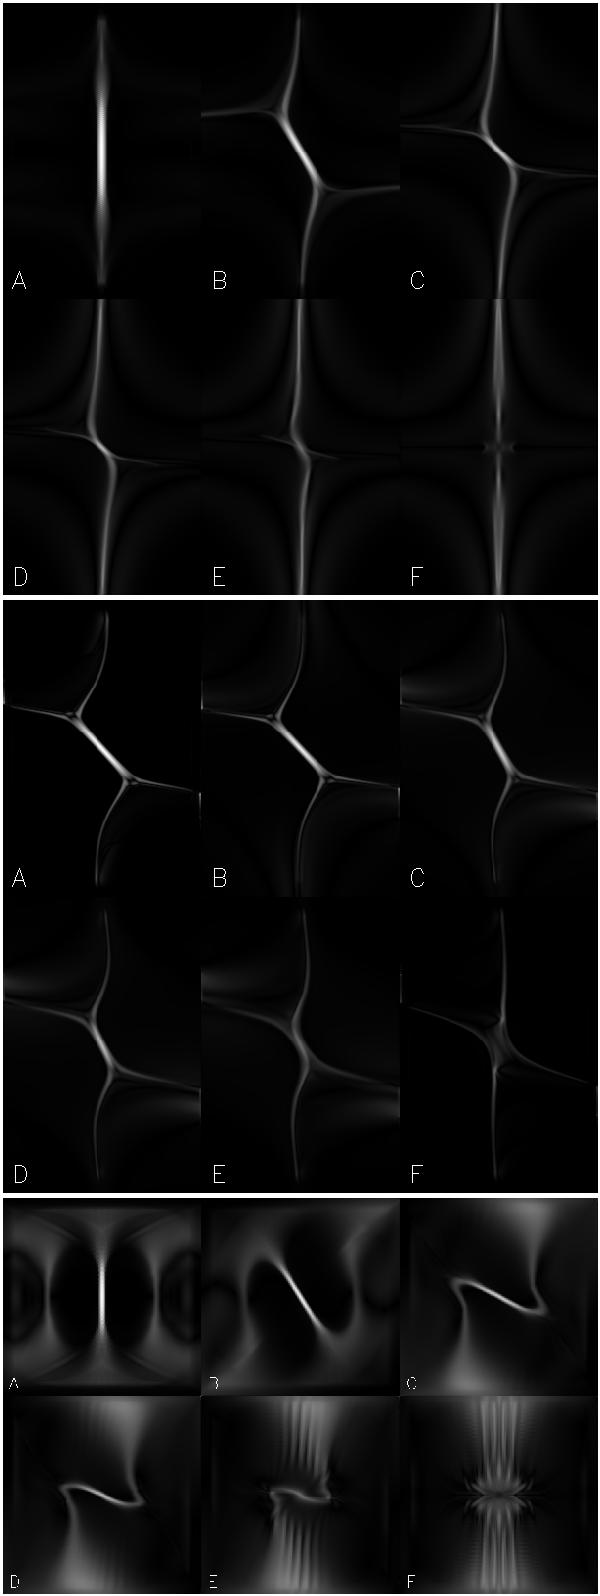
Images of the current structure for experiments A-F in Table 1 at t = 7.5. The top frame shows the xy-plane, the middle frame represents the xz-plane and finally the lower frame shows the yz-plane. In all frames the redundant coordinate is zero and the initial null point is therefore located at the centre of the images. The dynamical range in each of the frames are scaled according to the absolute peak current of the experiments.


Current usage metrics show cumulative count of Article Views (full-text article views including HTML views, PDF and ePub downloads, according to the available data) and Abstracts Views on Vision4Press platform.
Data correspond to usage on the plateform after 2015. The current usage metrics is available 48-96 hours after online publication and is updated daily on week days.
Initial download of the metrics may take a while.