Fig. 2
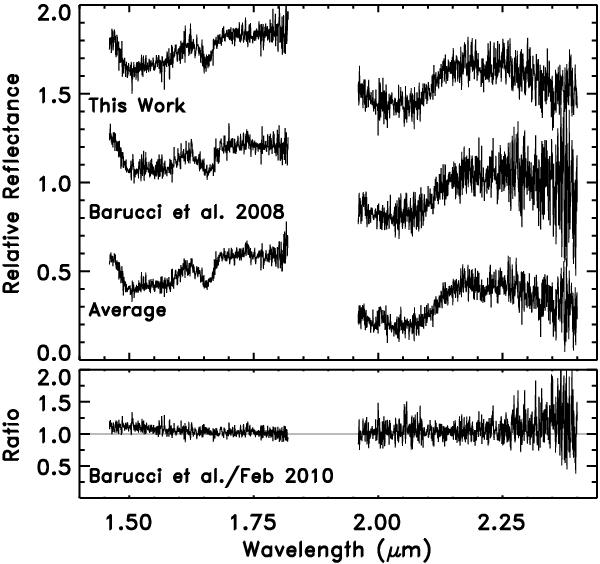
Upper panel: spectra of Orcus in the H and K bands from this work (top) and Barucci et al. (2008b) (middle). The bottom spectrum is an average of the two. The spectra are normalized to 1.0 at 1.75 μm and are shifted by +0.65, 0, and −0.4. The spectrum taken in March 2010 was significantly noisier than the two shown here so we neither plot it nor use it in our analysis. Lower panel: the ratio of the Barucci et al. data to data from this work, which shows little difference between the spectra apart from a small flux difference shortward of 1.65 μm.
Current usage metrics show cumulative count of Article Views (full-text article views including HTML views, PDF and ePub downloads, according to the available data) and Abstracts Views on Vision4Press platform.
Data correspond to usage on the plateform after 2015. The current usage metrics is available 48-96 hours after online publication and is updated daily on week days.
Initial download of the metrics may take a while.