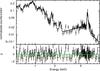
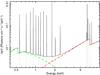
Fig. 2

(a) Left: the 0.5−10 keV spectrum of ESO 138−G1 when the best-fit model is applied. The lower panel shows the deviations of the observed data from the model in units of standard deviation. (b) Right: best-fit model for the broad band X-ray spectrum. This model (solid line) consists of a pure reflection component (dash-dotted line) plus an additional unobscured power-law component accounting for the soft X-ray scattered/leaked emission (dashed line). It also includes the hard and soft X-ray Gaussian emission lines listed in Tables 2 and 3, respectively.
Current usage metrics show cumulative count of Article Views (full-text article views including HTML views, PDF and ePub downloads, according to the available data) and Abstracts Views on Vision4Press platform.
Data correspond to usage on the plateform after 2015. The current usage metrics is available 48-96 hours after online publication and is updated daily on week days.
Initial download of the metrics may take a while.