Fig. 7
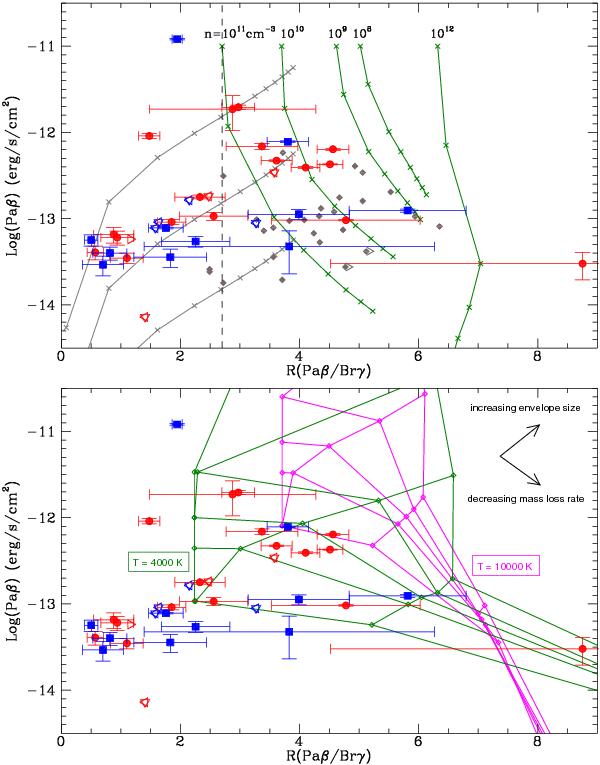
Paβ flux as a function of the Paβ/Brγ ratio for ChaI (red points) and ChaII (blue points) sources. The open triangles indicate upper/lower limits, depending on their orientation. All quantities are extinction-corrected. A comparison with various emission scenarios is presented (see text for details). (Upper panel) The grey solid lines show the expected emission from gas in an optically thick region in LTE and refer to three different emitting areas (0.2, 2, 20 × 1022 cm2) and temperatures (crosses) from 1000 to 12 000 K (from left to right in steps of 1000 K). The green curves on the right side of the plot show the expected emission in case-B conditions from a gas with density n, indicated at the top of each curve, and temperatures (crosses) from 500 to 15 000 K (downwards, steps corresponding to 500, 1000, 3000, 5000, 7500, 10 000, 12 500, and 15 000 K). The case B curves have been normalised to obtain the same Paβ emission at T = 500 K. The vertical dashed line at R ~ 2.7 marks the lower limit of the region where ratios are still compatible with optically thin emission in case B conditions. For comparison’s sake the grey diamonds show the ratios measured in Taurus CTTSs by Muzerolle et al. (1998b). (Lower panel) Results obtained from a model of a spherically symmetric expanding wind in LTE conditions (see Nisini et al. 1995) for gas temperatures of T = 4000 K (green) and T = 10 000 K (magenta) are overplotted. For each temperature the open diamonds show the expected emission for four different values of the mass loss rate (Ṁloss from 10-6 to 10-9 M⊙ yr-1) and envelope thickness (1, 2, 5, 10, and 100 R∗), these parameters varying in the direction indicated by the arrows. The lines (solid green for T = 4000 K and dotted-dashed magenta for T = 10 000 K) connect the results obtained with the same thickness or Ṁloss.
Current usage metrics show cumulative count of Article Views (full-text article views including HTML views, PDF and ePub downloads, according to the available data) and Abstracts Views on Vision4Press platform.
Data correspond to usage on the plateform after 2015. The current usage metrics is available 48-96 hours after online publication and is updated daily on week days.
Initial download of the metrics may take a while.