Free Access
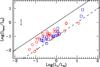
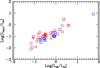
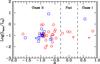
Fig. 5
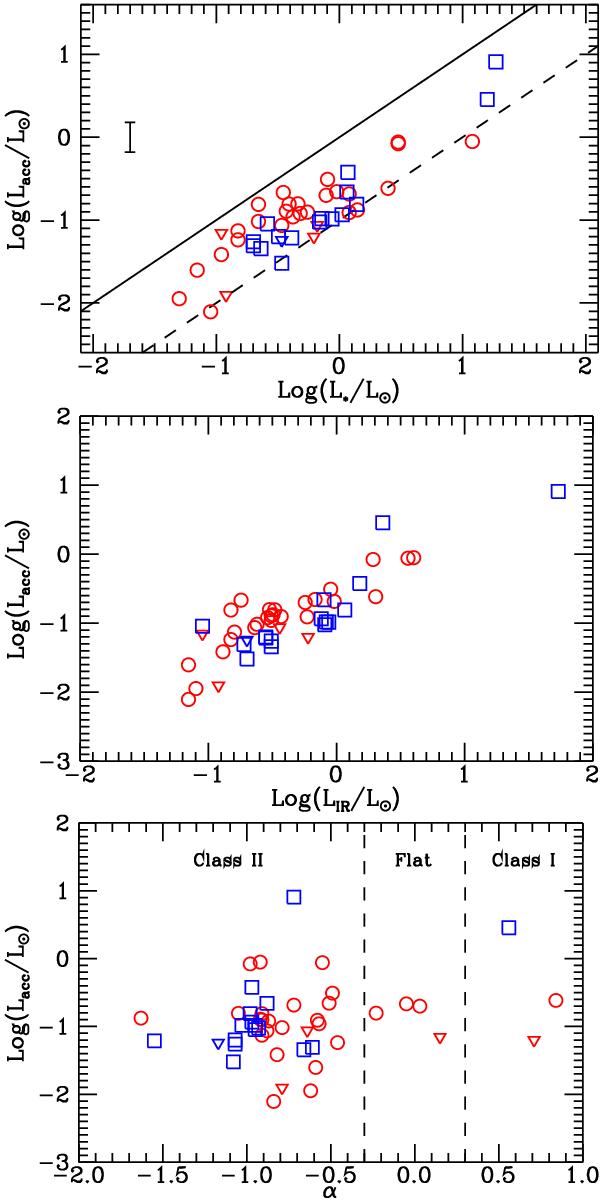
Accretion luminosity (derived from Brγ) as a function of L∗ (top), LIR (centre), and spectral index α2−24 (bottom). Red circles and blue squares refer to Cha I and Cha II sources, respectively, while triangles of the same colours mark upper limits on Lacc.
This figure is made of several images, please see below:
Current usage metrics show cumulative count of Article Views (full-text article views including HTML views, PDF and ePub downloads, according to the available data) and Abstracts Views on Vision4Press platform.
Data correspond to usage on the plateform after 2015. The current usage metrics is available 48-96 hours after online publication and is updated daily on week days.
Initial download of the metrics may take a while.