Fig. 4
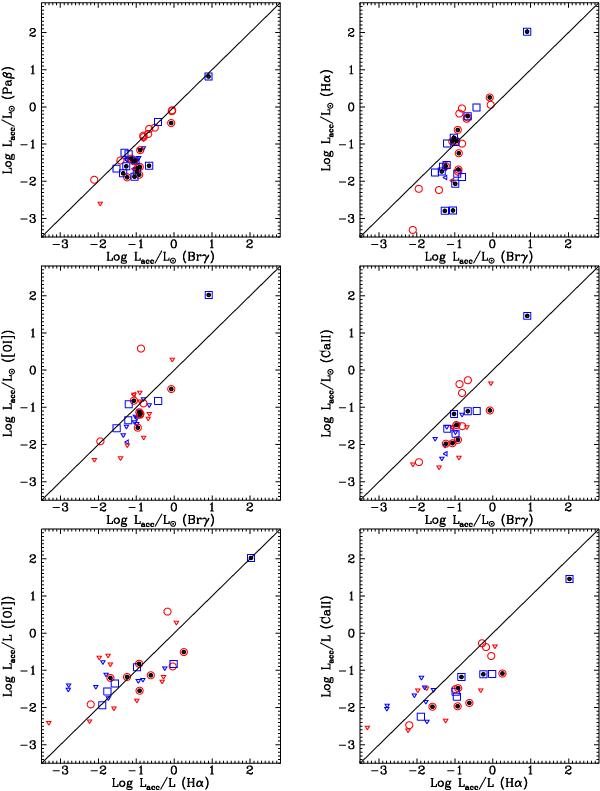
Comparison between Lacc(Brγ) and Lacc determinations from the other four tracers and between Lacc(Hα) and Lacc from [O i] and Ca ii. The red circles and blue squares refer to Cha I and Cha II objects, respectively, whereas the triangles of the same colours indicate upper limits. The dashed lines mark the locus of equal accretion luminosity. The symbols filled with a black dot identify the sources displaying low values of the Paβ/Brγ ratio (see Sect. 8 and Fig. 7).
Current usage metrics show cumulative count of Article Views (full-text article views including HTML views, PDF and ePub downloads, according to the available data) and Abstracts Views on Vision4Press platform.
Data correspond to usage on the plateform after 2015. The current usage metrics is available 48-96 hours after online publication and is updated daily on week days.
Initial download of the metrics may take a while.