Free Access
Fig. 8
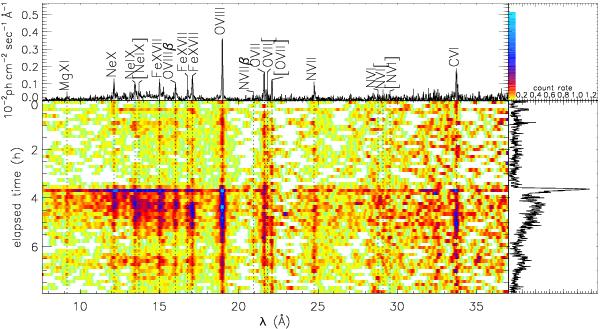
Time evolution of RGS spectra of Proxima Centauri. Prominent emission lines are labelled in the mean spectrum shown in the upper part of the graph. In the right panel, the associated light curve can be found.
Current usage metrics show cumulative count of Article Views (full-text article views including HTML views, PDF and ePub downloads, according to the available data) and Abstracts Views on Vision4Press platform.
Data correspond to usage on the plateform after 2015. The current usage metrics is available 48-96 hours after online publication and is updated daily on week days.
Initial download of the metrics may take a while.