Fig. 14
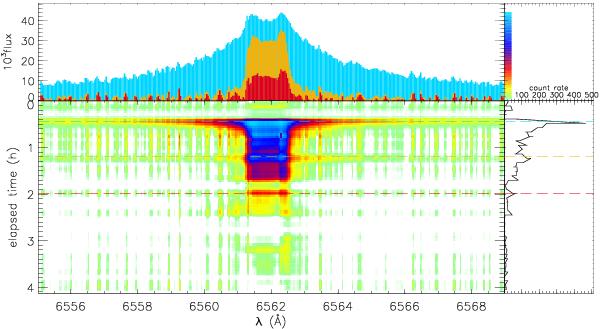
The Hα line variations in time with the quiescence spectrum No. 74 subtracted. The top panel shows three individual spectra as marked by the horizontal dashed lines in the time map below. On the right hand panel, we show the light curve of the integrated flux of the quiescence subtracted spectrum for the shown wavelength region. The time is measured in elapsed time since 5:50 UT.
Current usage metrics show cumulative count of Article Views (full-text article views including HTML views, PDF and ePub downloads, according to the available data) and Abstracts Views on Vision4Press platform.
Data correspond to usage on the plateform after 2015. The current usage metrics is available 48-96 hours after online publication and is updated daily on week days.
Initial download of the metrics may take a while.