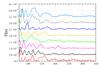
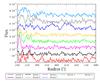
Fig. 5

Mean intensity enhancements (in Jy/arcsec2) in each sector of the PACS 100 μm image (see Fig. 4). The position angle covered by each sector is listed in Table 1. The different sectors are offset to each other. The upper panel shows the intensity (in Jy/arcsec2) in the arcs between 65′′ and 350′′ away from the central target, while the lower panel shows the outermost arcs until 600′′ away. The bowshock as discussed by Ladjal et al. (2010) is seen at ~450′′ in sector 5 (see also Appendix B).
Current usage metrics show cumulative count of Article Views (full-text article views including HTML views, PDF and ePub downloads, according to the available data) and Abstracts Views on Vision4Press platform.
Data correspond to usage on the plateform after 2015. The current usage metrics is available 48-96 hours after online publication and is updated daily on week days.
Initial download of the metrics may take a while.