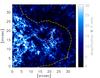
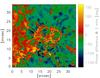
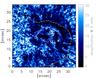
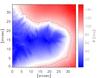
Fig. 3

a) Amplification map at 3 mHz from IBIS data. b) Phase lag between photosphere and chromosphere at 3 mHz (positive values mean upward propagation) from IBIS data. c) Amplification map at 5 mHz from IBIS data. d) Chromospheric magnetic field inclination as inferred from extrapolations of the Merlin magnetic vector map of Hinode data. Continuous contours approximatively indicate the position of the umbra, and dashed contours in the amplification maps indicate the position where the chromospheric magnetic field is 90 degrees inclined with respect to the LoS.
Current usage metrics show cumulative count of Article Views (full-text article views including HTML views, PDF and ePub downloads, according to the available data) and Abstracts Views on Vision4Press platform.
Data correspond to usage on the plateform after 2015. The current usage metrics is available 48-96 hours after online publication and is updated daily on week days.
Initial download of the metrics may take a while.