Free Access
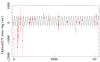
Fig. 7

Upper panel: the optical/UV (red filled squares) time-lags fitted with a sinusoidal function f(t) (solid line) with a period of 283 days (see text). Lower panel: residuals in units of σ with respect to the best-fit sinusoidal function. (This figure is available in color in the electronic form.)
This figure is made of several images, please see below:
Current usage metrics show cumulative count of Article Views (full-text article views including HTML views, PDF and ePub downloads, according to the available data) and Abstracts Views on Vision4Press platform.
Data correspond to usage on the plateform after 2015. The current usage metrics is available 48-96 hours after online publication and is updated daily on week days.
Initial download of the metrics may take a while.