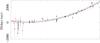
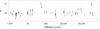
Fig. 5

Upper panel: the optical/UV (black filled squares) and X-ray (red filled squares) time delays fitted with two parabolas having the same linear and quadratic terms. The solid and dashed parabolas correspond to the X-ray and optical/UV best-fit curves. Lower panel: residuals in units of σ with respect to the best-fit parabola describing the X-ray ephemeris shown in Eq. (5). (This figure is available in color in the electronic form.)
Current usage metrics show cumulative count of Article Views (full-text article views including HTML views, PDF and ePub downloads, according to the available data) and Abstracts Views on Vision4Press platform.
Data correspond to usage on the plateform after 2015. The current usage metrics is available 48-96 hours after online publication and is updated daily on week days.
Initial download of the metrics may take a while.