Fig. 8
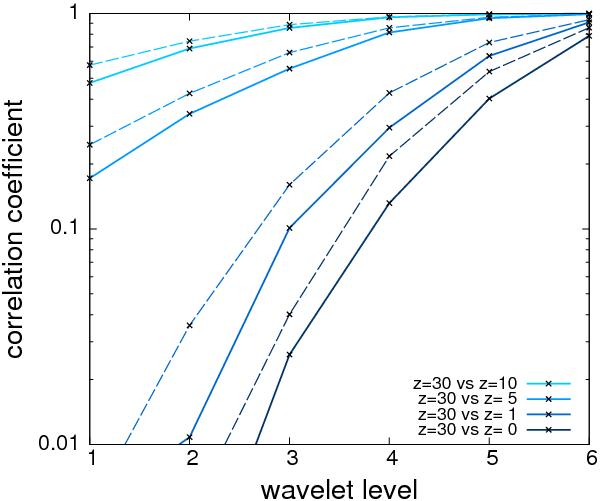
The behaviour of the correlation coefficient for different redshift pairs (zi,zj) ∈ { (30,10);(30,5);(30,1);(30,0) } for all the six wavelet levels. The solid and dashed lines correspond to the under- and overdensities, respectively (10% of the most under/over-dense cells). We see that for the largest smoothing scale, i.e. w6, all the correlators stay quite close to r = 1, while later on, as the other redshift decreases below z = 30, the lines start to deviate from r = 1. Thus, on the largest scales the information is approximately preserved, while on the smallest scales the information gets gradually erased.
Current usage metrics show cumulative count of Article Views (full-text article views including HTML views, PDF and ePub downloads, according to the available data) and Abstracts Views on Vision4Press platform.
Data correspond to usage on the plateform after 2015. The current usage metrics is available 48-96 hours after online publication and is updated daily on week days.
Initial download of the metrics may take a while.