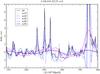
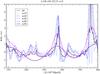
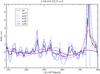
Fig. 5
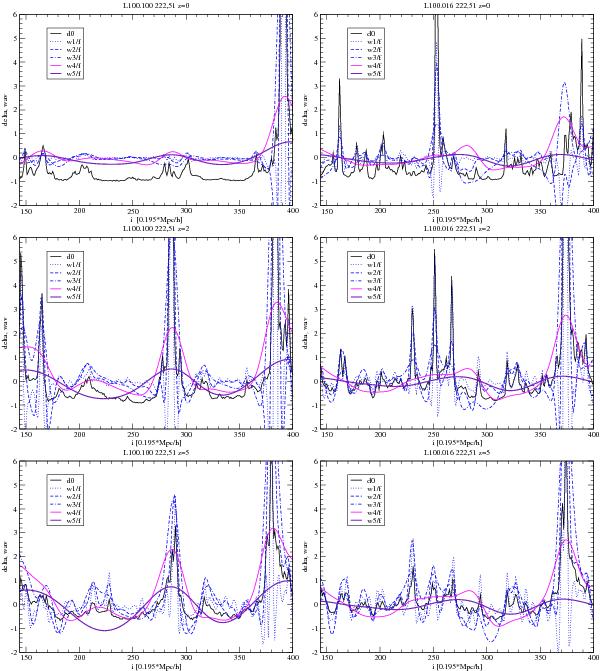
The evolution of the local density and wavelets of the models L100.100 (left panels) and L100.016 (right panels) in beams along the i-coordinate at j = 220, k = 51. The same k-coordinate was used in plotting the density field in Fig. 3. Data are shown for epochs z = 0, 2, 5. To see better details only the region 144 ≤ i ≤ 400 of length 50 h-1Mpc is shown. The characteristic scale of the wavelet w5 is 12.5 h-1Mpc. Wavelets are divided by the factor f ∝ (1 + z)-1.
Current usage metrics show cumulative count of Article Views (full-text article views including HTML views, PDF and ePub downloads, according to the available data) and Abstracts Views on Vision4Press platform.
Data correspond to usage on the plateform after 2015. The current usage metrics is available 48-96 hours after online publication and is updated daily on week days.
Initial download of the metrics may take a while.