Fig. 4
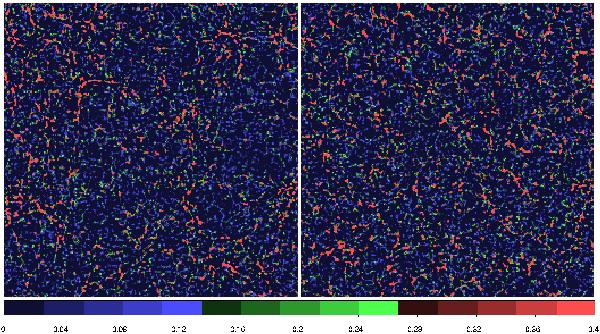
Wavelets w1 of models L100.100 and L100.008 at redshift z = 10 are shown in the left and right panels, respectively, at coordinate k = 51. Densities are expressed on a linear scale, only over-density regions are shown. As in Fig. 3, the central 256 × 256 pixels of the full models are shown. The characteristic scale of density perturbations corresponding to this wavelet is 0.4 h-1Mpc. Note the weakening of peak densities of the model L100.100 in the region of future large under-dense region, seen in Fig. 3.
Current usage metrics show cumulative count of Article Views (full-text article views including HTML views, PDF and ePub downloads, according to the available data) and Abstracts Views on Vision4Press platform.
Data correspond to usage on the plateform after 2015. The current usage metrics is available 48-96 hours after online publication and is updated daily on week days.
Initial download of the metrics may take a while.