Fig. 3
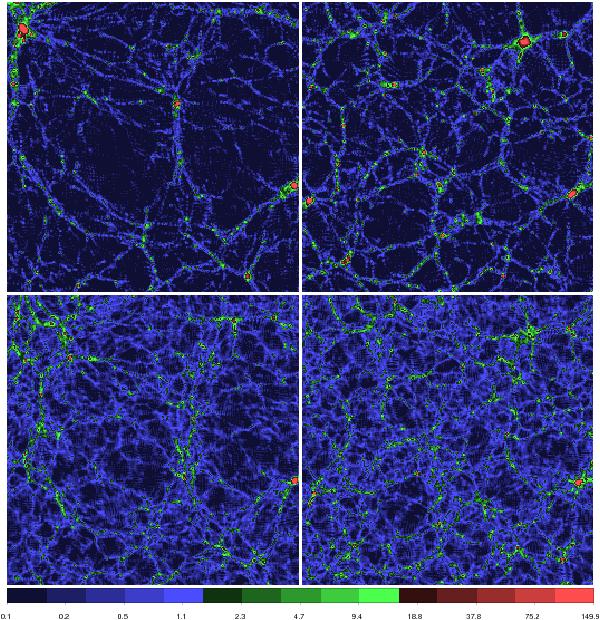
Zoom-ins to the high-resolution density fields of the models L100.100 and L100.016, left and right columns, respectively. Zoom factor is 2, central 50 × 50 h-1Mpc (256 × 256 pixels) of all models are shown. Upper panels are for the present epoch z = 0, lower panels for the epoch z = 2. All panels are at the k = 51 coordinate. Cross sections (beams) at coordinates j = 222 and k = 51 for both models are shown in Fig. 5 for three redshifts to see the evolution of the density field and its wavelets. In the upper left corner of the figure there is a rich supercluster in the model L100.100, absent in the model L100.016. Both models have at the right edge of the figure a rich cluster. This cluster is well seen in Fig. 5 at i = 390 coordinate. Densities are expressed in the logarithmic scale, identical lower and upper limits for plotting with the SAO DS9 package are used. The border between the light blue and the dark green colours corresponds to the critical density Dloc = 1.6, which separates low-density haloes and haloes collapsed during the Hubble time (Kaiser 1984; Bardeen et al. 1986). Note that in both models and simulation epochs the majority of filaments in voids have densities below the critical density.
Current usage metrics show cumulative count of Article Views (full-text article views including HTML views, PDF and ePub downloads, according to the available data) and Abstracts Views on Vision4Press platform.
Data correspond to usage on the plateform after 2015. The current usage metrics is available 48-96 hours after online publication and is updated daily on week days.
Initial download of the metrics may take a while.