Fig. 4
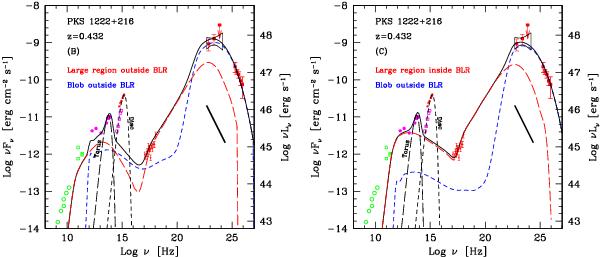
As in Fig. 3 but with the model corresponding to emission from the compact region and the standard jet. The blue short dashed line shows the emission from the compact region, while the red long dashed line reports the emission from the large region of the jet. The solid black line is the sum of the two. The left panel shows the case in which both emission regions are located outside the BLR (case B); the right panel represents the case in which the large region is within the BLR (case C).
Current usage metrics show cumulative count of Article Views (full-text article views including HTML views, PDF and ePub downloads, according to the available data) and Abstracts Views on Vision4Press platform.
Data correspond to usage on the plateform after 2015. The current usage metrics is available 48-96 hours after online publication and is updated daily on week days.
Initial download of the metrics may take a while.