Free Access
Fig. 3
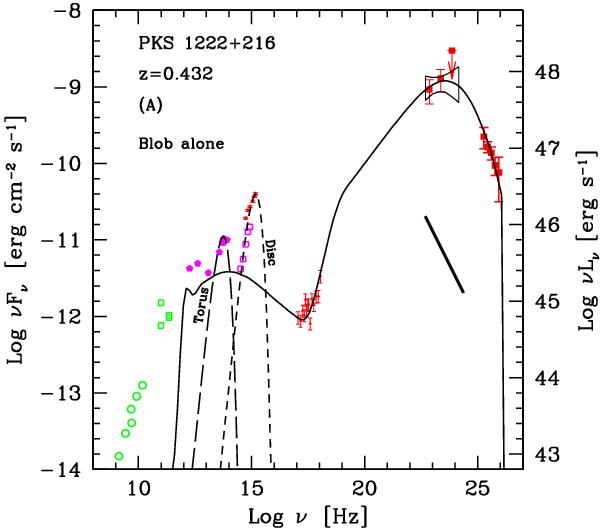
As in Fig. 1 but with the model considering only a compact emission region located beyond the BLR (see text for details). Black short and long dashed curve show the assumed emission from the accretion disk and dusty torus. For clarity, the XRT spectrum of May 29 is not presented.
Current usage metrics show cumulative count of Article Views (full-text article views including HTML views, PDF and ePub downloads, according to the available data) and Abstracts Views on Vision4Press platform.
Data correspond to usage on the plateform after 2015. The current usage metrics is available 48-96 hours after online publication and is updated daily on week days.
Initial download of the metrics may take a while.