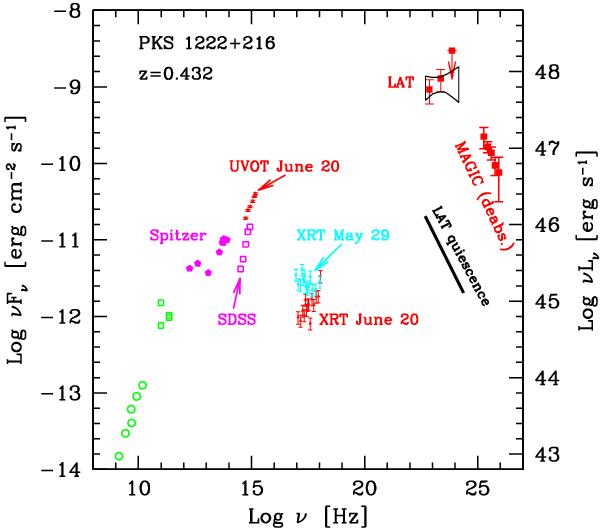
Fig. 1

Spectral energy distribution of PKS 1222+216 close to the epoch of the MAGIC detection (2010 June 17). Red points at optical-UV and X-ray frequencies are from a Swift observation of June 20. For comparison, cyan data-points show the X-ray spectrum two weeks before, on May 29 (see text). Fermi/LAT (red squares and “bow tie”) and MAGIC data (corrected for absorption by the EBL using the model of Dominguez et al. 2011) are taken from Aleksic et al. (2011b). The thick black solid line shows the LAT spectrum in quiescence (from Tanaka et al. 2011). Magenta open squares are SDSS photometric points. Magenta filled pentagons are IR data from Malmrose et al. (2011). Green points report historical data (from NED, circles, and Tornikoski et al. 1996, squares).
Current usage metrics show cumulative count of Article Views (full-text article views including HTML views, PDF and ePub downloads, according to the available data) and Abstracts Views on Vision4Press platform.
Data correspond to usage on the plateform after 2015. The current usage metrics is available 48-96 hours after online publication and is updated daily on week days.
Initial download of the metrics may take a while.


