Fig. 6
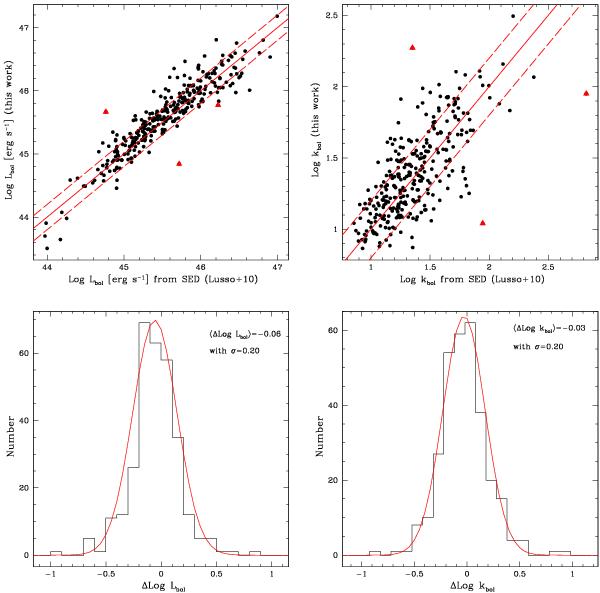
Upper panel: comparison between the values of bolometric luminosity and bolometric correction from data presented in L10 and from this work. The three red triangles mark the outliers discussed in Sect. 7. Lower panel: distribution of the differences between the values of bolometric luminosity and bolometric correction from data presented in L10 and from this work.
Current usage metrics show cumulative count of Article Views (full-text article views including HTML views, PDF and ePub downloads, according to the available data) and Abstracts Views on Vision4Press platform.
Data correspond to usage on the plateform after 2015. The current usage metrics is available 48-96 hours after online publication and is updated daily on week days.
Initial download of the metrics may take a while.