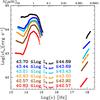
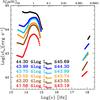
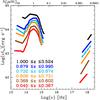
Fig. 4
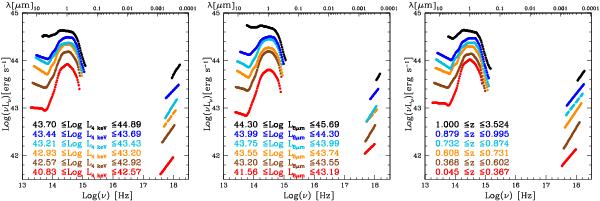
Average SEDs in the rest-frame Log (νLν) − Log ν plane. Right panel: mean SEDs computed binning in X-ray luminosity at 4 keV. Center panel: mean SEDs computed binning in infrared luminosity at 8 μm. Left panel: mean SEDs computed binning in redshift. The color code refers to the different bins as labeled.
Current usage metrics show cumulative count of Article Views (full-text article views including HTML views, PDF and ePub downloads, according to the available data) and Abstracts Views on Vision4Press platform.
Data correspond to usage on the plateform after 2015. The current usage metrics is available 48-96 hours after online publication and is updated daily on week days.
Initial download of the metrics may take a while.