Free Access
Fig. 3
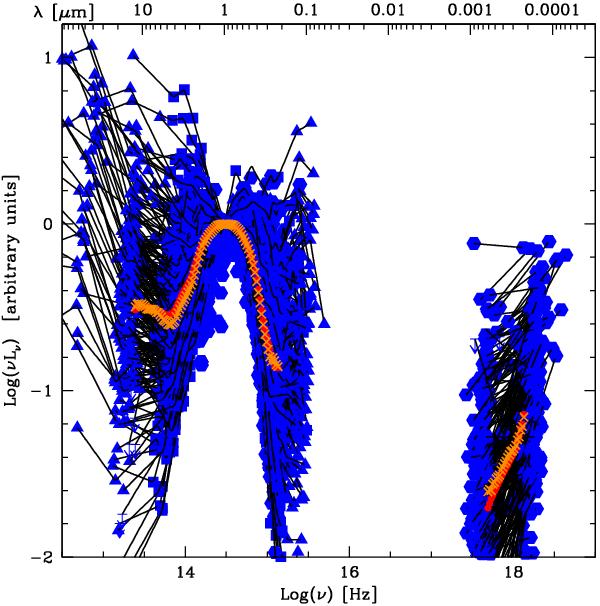
Mean (orange crosses) and median (red points) SED from the total sample of 255 type-2 AGN. The blue points represent the rest-frame data, from infrared to X-ray, used to construct the average SED, while the black lines represent the interpolated SED.
Current usage metrics show cumulative count of Article Views (full-text article views including HTML views, PDF and ePub downloads, according to the available data) and Abstracts Views on Vision4Press platform.
Data correspond to usage on the plateform after 2015. The current usage metrics is available 48-96 hours after online publication and is updated daily on week days.
Initial download of the metrics may take a while.