Fig. 15
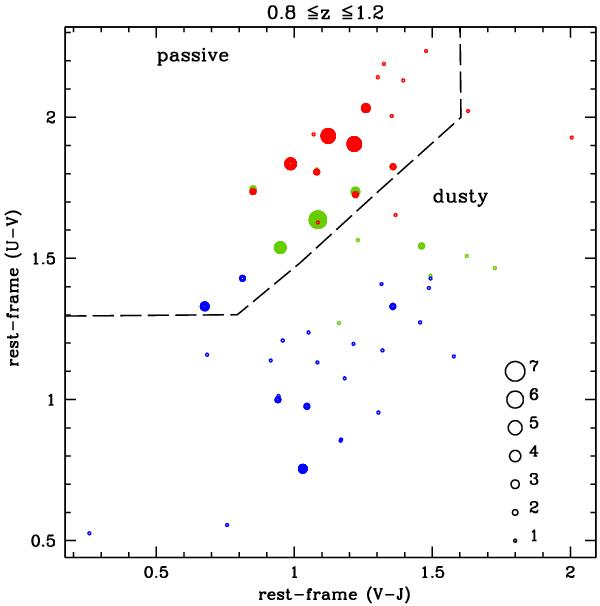
Distribution of type-2 AGN hosts in the rest-frame (U − V) against the rest-frame (V − J) color. Color coded as in Fig. 13. Sources with the same best-fit galaxy template and the same extinction lie in the same position in the color-color diagram. Point size is keyed to the number of objects.
Current usage metrics show cumulative count of Article Views (full-text article views including HTML views, PDF and ePub downloads, according to the available data) and Abstracts Views on Vision4Press platform.
Data correspond to usage on the plateform after 2015. The current usage metrics is available 48-96 hours after online publication and is updated daily on week days.
Initial download of the metrics may take a while.