Fig. 14
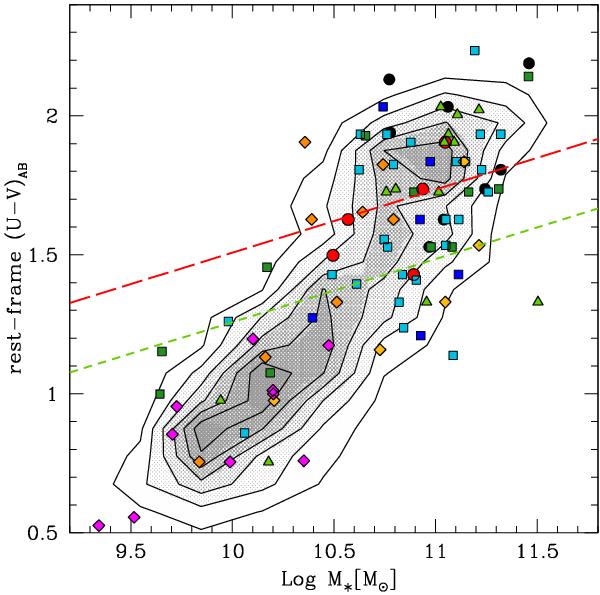
Distribution of the stellar masses as a function of the rest-frame (U − V) colors in the redshift range 0.8 ≤ z ≤ 1.2. The red dashed line represents the red sequence cut defined by Borch et al. (2006), while the green short dashed line defines an approximate green valley region, both lines are calculated at redshift ~1. The points are color coded as in Fig. 12.
Current usage metrics show cumulative count of Article Views (full-text article views including HTML views, PDF and ePub downloads, according to the available data) and Abstracts Views on Vision4Press platform.
Data correspond to usage on the plateform after 2015. The current usage metrics is available 48-96 hours after online publication and is updated daily on week days.
Initial download of the metrics may take a while.