Fig. 10
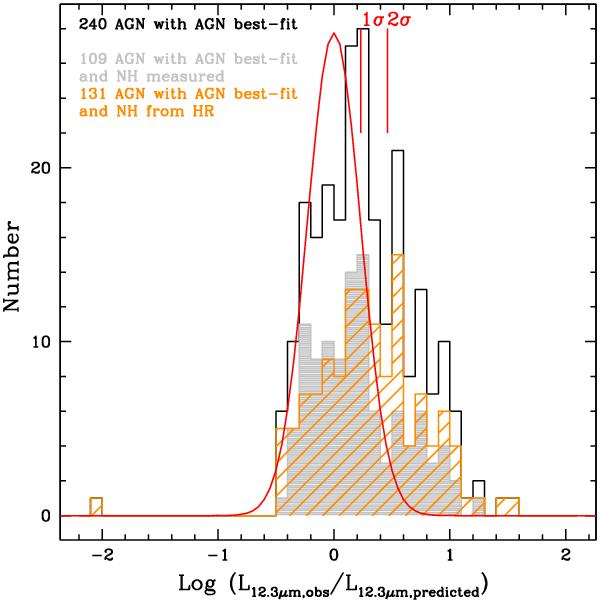
Histogram of the ratio between the total observed luminosity at 12.3 μm and the mid-infrared luminosity predicted by Eq. (4). The red curve represents a gaussian with mean equal to zero and standard deviation 0.23. The 1σ and 2σ standard deviations of the correlation are also reported.
Current usage metrics show cumulative count of Article Views (full-text article views including HTML views, PDF and ePub downloads, according to the available data) and Abstracts Views on Vision4Press platform.
Data correspond to usage on the plateform after 2015. The current usage metrics is available 48-96 hours after online publication and is updated daily on week days.
Initial download of the metrics may take a while.