Fig. 17
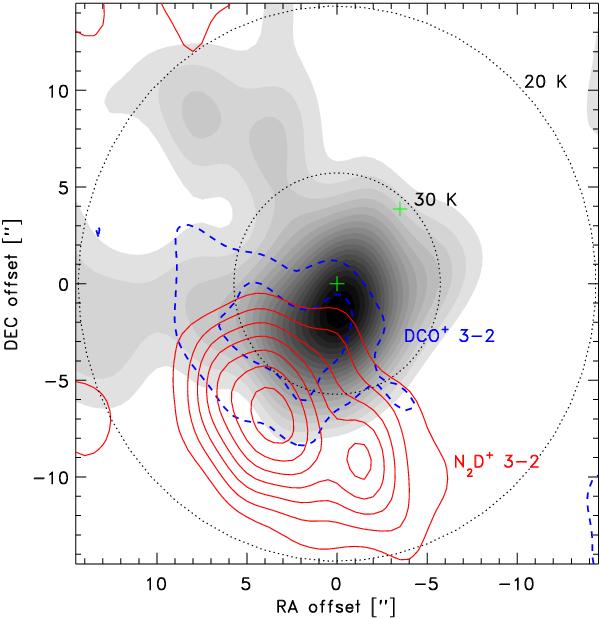
Comparison between the C18O 2–1 (grey-scale), DCO+ 3–2 (dashed blue contours) and N2D+ 3–2 toward the core. The lines are integrated from velocities of 3–7 km s-1 (C18O and N2D+) and 4–6 km s-1 (DCO+). The dotted circles indicate the projected radii, where the dust temperature from radiative transfer calculations (Schöier et al. 2002; Jørgensen et al. 2005a) has dropped to 30 K and 20 K, respectively – assuming that the IRAS 16293A component is the sole source of luminosity and that the envelope is centered on this source.
Current usage metrics show cumulative count of Article Views (full-text article views including HTML views, PDF and ePub downloads, according to the available data) and Abstracts Views on Vision4Press platform.
Data correspond to usage on the plateform after 2015. The current usage metrics is available 48-96 hours after online publication and is updated daily on week days.
Initial download of the metrics may take a while.